
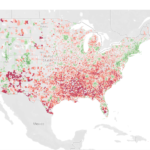
Income – Below Average
This map shows an aggregate zip code map of households with above and below average ownership of desktop or laptops. All areas in green are zip codes with median household device ownership which is above the national average (> 74%). While areas in red are zip codes with median household device ownership which is below the national average (< 73%).
INTERACTIVE MAP
See the map in action on Tableau Public.